A new composite index measuring financial market stress in Kazakhstan, built from FX and money-market data specific to the country's structure — updated daily at eigenaxis.io.
Azat Tersebayev

Financial stress rarely announces itself in advance. In a market where individual indicators can be thin and noisy, the hard part is separating signal from noise — is a given move just static in one variable, or the early sign of a shift that’s affecting conditions broadly? By the time the answer is obvious, the damage is already done. The practitioner’s challenge has always been to read the early signals before they become headlines.
For most markets, that task is supported by a reasonably rich toolkit: financial conditions indices, credit spread monitors, implied volatility surfaces. For Kazakhstan — an emerging market of rising economic significance, sitting at the intersection of Russian, Chinese, and global capital flows — that toolkit is still developing.
This article introduces the Kazakhstan Market Conditions Index (KZ-MCI): a composite measure of financial market stress constructed specifically for Kazakhstan’s market structure, updated daily, and available live at eigenaxis.io.
Why Kazakhstan Needs Its Own Index
Generic emerging market stress indices are ineffective for Kazakhstan for a straightforward reason: they are built on variables that do not reflect how Kazakhstan’s financial system actually works.
Kazakhstan’s money markets are dominated by overnight and term repo operations — not interbank lending — and the National Bank (NBRK) sits at the center of that market from more than one direction. It conducts the open market operations that enforce the policy rate, and it also acts as the effective manager of the country’s major state funds, including the Unified Accumulative Pension Fund (ENPF) — one of the largest participants in repo trading. The securities market shows a similar concentration, dominated by NBRK itself alongside a handful of commercial banks and brokerages. Its banking system carries structural excess liquidity accumulated from years of quasi-fiscal injections and unsterilized FX reserve accumulation, a dynamic an IMF working paper has documented in detail. Yet despite this excess liquidity, the government bond market remains relatively illiquid — liquidity and depth don’t move together here the way a simpler market would suggest. Watching the USD/KZT rate alone would tell you very little about the actual state of the market.
The KZ-MCI is built from the ground up on the variables that actually matter for Kazakhstan’s market structure.
Construction: What Goes In
The KZ-MCI draws on two clusters of daily market data sourced from KASE (Kazakhstan Stock Exchange) and NBRK.
FX stress cluster captures the degree of dislocation in the USD/KZT market:
Absolute daily log returns — measuring turbulence in either direction
Signed 5-day and 21-day moving average returns — separately measuring directional depreciation pressure
Realized volatility at 5-day and 21-day horizons
Combined TOD and TOM settlement volume — capturing market activity levels
Money market stress cluster captures the functioning of Kazakhstan’s funding markets:
TONIA (overnight repo rate) spread versus the NBK base rate
TWINA (14-day repo rate) spread versus the NBK base rate
Term spread between TWINA and TONIA — the shape of the repo curve
1-day and 2-day currency swap spreads versus TONIA — cross-currency funding premium
Repo market volume — capturing structural liquidity conditions
Swap market volume — capturing demand for cross-currency funding
All variables are expressed so that higher values indicate worse conditions. The index is then constructed using expanding-window Principal Component Analysis (PCA): starting with an 18-month initial estimation window in mid-2016, the window expands by one month at each step, re-estimating the covariance structure with all available history each time. The first principal component — the linear combination of inputs that explains the maximum shared variance — becomes the raw index. It is then normalized to zero mean and unit standard deviation, so that readings are directly interpretable: zero is average conditions, positive values indicate stress above the historical mean, and negative values indicate unusually easy conditions.
The expanding window design is deliberate. Unlike a fixed rolling window that discards older observations, the expanding window retains all historical stress episodes in the covariance structure. It never forgets the 2020 Covid shock or the 2022 Russia-Ukraine war shock — events that anchor the calibration of what "severe stress" looks like for Kazakhstan’s markets.
What the Loadings Reveal: A Kazakhstan-Specific Story
The most analytically interesting output of the PCA methodology is not the index itself, but the factor loadings — the weights assigned to each variable at each point in time. These reveal not just what drives market stress in Kazakhstan, but how that relationship has evolved as policy frameworks have matured.
Money market spreads dominate. The TONIA, TWINA, and swap spreads consistently carry the highest positive loadings throughout the sample — accounting for roughly 57% of the variance explained by the first principal component on average. This is the correct result for Kazakhstan. Funding market stress — the cost and availability of short-term liquidity — is the primary transmission channel through which broader shocks enter Kazakhstan’s financial system. The FX market reacts; the money market transmits.
TONIA volume loads negatively — and this is a feature, not a bug. In most textbook treatments, high interbank lending volume signals stress as banks scramble for funding. In Kazakhstan, the opposite is true. High TONIA repo volume reflects the ENPF and commercial banks actively deploying structural excess liquidity into the market — a sign of abundant funding conditions. Low volume signals liquidity providers stepping back, which is the actual stress indicator. The PCA found this relationship without being told about it. The negative loading on TONIA volume is the index’s way of encoding Kazakhstan’s unique institutional structure, where a large sovereign pension fund acts as a structural market maker in the money market.
The term spread also loads negatively — another Kazakhstan-specific result. When excess liquidity is abundant, it pushes the overnight rate (TONIA) toward the lower bound of NBRK’s interest rate corridor, widening the spread between the 14-day rate and overnight. During stress, the overnight rate spikes toward the upper corridor bound while the 14-day rate adjusts more slowly — compressing the term spread. So a compressed term spread signals stress, while a wide term spread signals easy conditions. This is the opposite of the textbook prediction, but it is the correct result for a corridor-based monetary framework with structural excess liquidity.
FX volume reflects a market that has grown deeper. The loading on FX trading volume has shifted from positive to slightly negative over the course of the sample, crossing into negative territory in April 2021. Earlier in the sample, high FX volume was more closely associated with stress-driven demand for dollars — volume spikes tended to coincide with periods of pressure on the tenge. As average daily turnover grew over the following years, high-volume days became a less reliable stress signal on their own; by the time the loading turns negative, elevated volume looks more consistent with routine market depth than with panic buying. We think a few factors probably contributed to this shift, though we can’t isolate how much each one matters: broader growth in FX market participation and turnover over the decade, and NBRK’s move toward pre-announcing monthly National Fund conversion volumes from the early 2020s, which we suspect added some predictability to flows and may have helped reduce their association with stress. The PCA picked up this gradual change in the loading without being told about any of these developments — a useful illustration of why the expanding-window methodology can track a market whose structure keeps evolving.
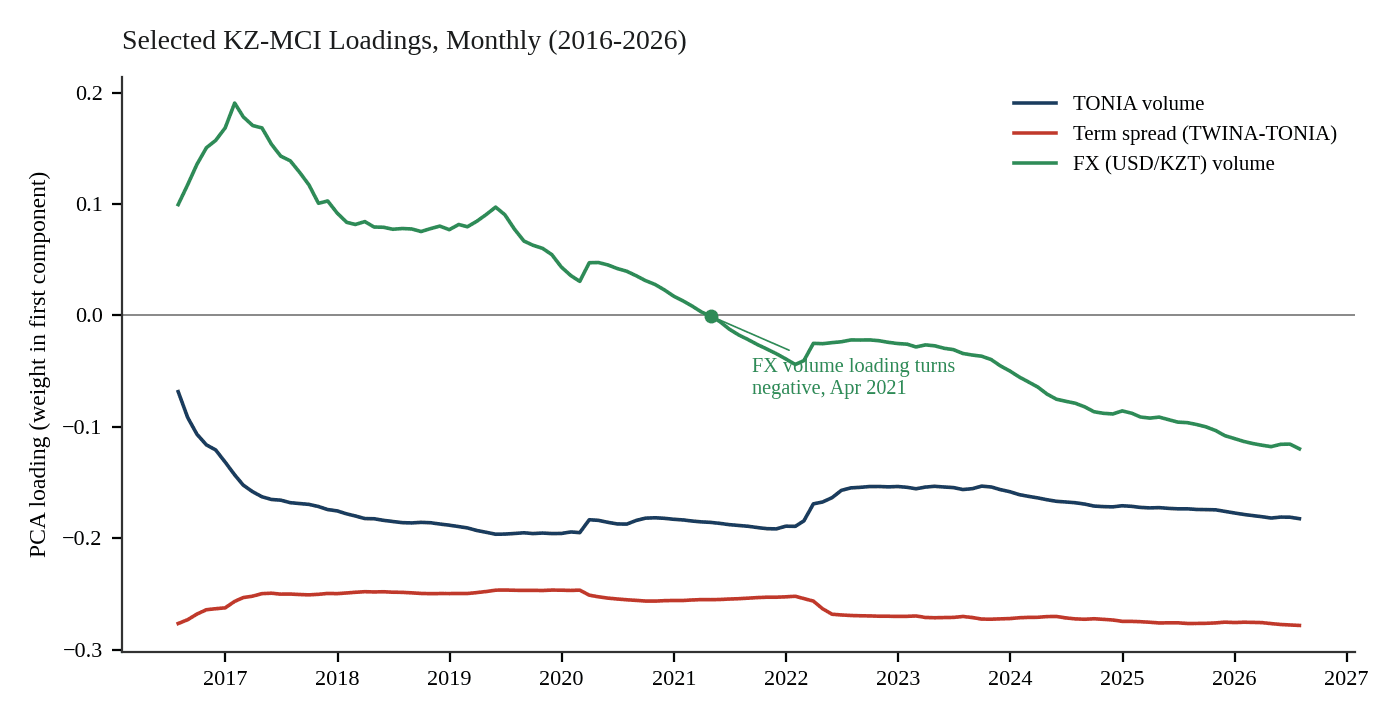
Figure 1. Selected PCA loadings, monthly, July 2016-July 2026. The FX volume loading crosses from positive to negative in April 2021. Source: Eigen Axis, KZ-MCI.
Validation: Five Episodes of Market Stress
The ultimate test of any stress index is whether it lights up when it should. Across the full sample, the KZ-MCI registers an elevated reading (above +1σ) in roughly 8% of months and a severe reading (above +2σ) in roughly 4% — a right-skewed distribution consistent with the episodic nature of financial stress: calm is the norm, and severe episodes are rare by construction.

Figure 2. KZ-MCI, monthly, July 2016-July 2026. Shaded bands mark elevated (+1σ) and severe (+2σ) territory. Source: Eigen Axis, KZ-MCI (Option 1).
The 2015–2016 devaluation is the one episode the index cannot fully see. Kazakhstan moved to a freely floating exchange rate in August 2015, and the most acute stress — the transition itself, plus the trough in oil prices below $30/barrel in early 2016 — falls inside the 18-month window used to initialize the estimation. What the index does capture, from July 2016 onward, is the aftermath: readings through the rest of 2016 and into early 2017 are among the calmest in the entire sample, consistent with markets settling into the new regime once the acute phase had passed. This is a structural limitation of any expanding-window design with a fixed start date, not a shortcoming of the PCA itself — see Limitations below.
The 2018 EM selloff registers at +0.88σ — below the elevated threshold but visible above the average. This calibration is correct. Kazakhstan was affected by the broader emerging market selloff and the RUB crisis spillover, but its response was more contained than peers. A reading that registers but does not breach the elevated threshold reflects the episode accurately.
The March 2020 Covid and oil shock reaches +4.22σ — the second-highest reading in the sample. This is where the signed FX return variables make a critical difference. The Covid shock was not just volatile; it was persistently directional. The tenge depreciated sharply and continuously for several weeks as oil prices collapsed and global risk-off sentiment dominated. The 5-day and 21-day moving average returns capture this sustained depreciation pressure in a way that absolute volatility alone cannot, amplifying the reading appropriately and placing this episode in its correct position as Kazakhstan’s second most severe market stress event in the sample.
The February-March 2022 Russia-Ukraine war shock peaks at +4.98σ in March — the highest sustained reading in the sample. Unlike the sharp but brief Covid spike, this episode remained elevated for six months, with readings above +1σ persisting through the third quarter of 2022. This persistence reflects the genuine complexity of the period: Kazakhstan’s economy carries substantial trade, financial, and remittance linkages with Russia, and markets faced an extended stretch of regional uncertainty and currency pass-through effects. The index’s gradual normalization through late 2022 is not a flaw — it is an accurate description of what markets experienced.
The 2025 rates shock is more subtle but present. Three consecutive NBRK base rate hikes between January and July 2025 — a deliberate policy tightening — mechanically widened money market spreads and were followed by a broad selloff across Kazakhstan’s bond yield curve. What distinguishes this episode from ordinary policy transmission is that at least one market maker withdrew from providing quotes during the selloff, a signal of market dysfunction beyond what rate policy alone would be expected to produce. The KZ-MCI captures the episode at approximately +0.9σ to +1.3σ across the affected months — correctly elevated without reaching severe territory, consistent with contained disruption rather than systemic stress. The 2025 episode is likely somewhat understated in the current version of the index, which does not yet include bond market variables directly — an extension planned for a future version.
Current Conditions: June–July 2026
The KZ-MCI eased steadily through the second quarter of 2026, moving from +0.86σ in May to +0.48σ by late June, and continued easing into the first days of July, touching roughly -0.8σ — its calmest reading since the start of the year. This is consistent with the broader macro context. NBRK reduced the base rate by 100 basis points in June 2026 as inflation moderated from its September 2025 peak of 12.9% toward 10.4% in May. Money market spreads have compressed steadily through this period. As with any real-time index, the most recent daily readings sit at the edge of the estimation window and can be revised modestly as settlement data is finalized in the days that follow — but the direction of travel through late June and into July is unambiguous: conditions are normalizing as the rate cycle works through the system, rather than reflecting any acute market stress.
The IMF’s June 2026 staff visit assessment reaches a broadly similar conclusion, noting that banks remain well-capitalized and liquid. The KZ-MCI’s steady easing through late June and into July is consistent with that characterization: conditions normalizing, not stressed.
Limitations and What Comes Next
Any index is a simplification, and the KZ-MCI is no exception. Three limitations are worth stating explicitly.
The sample begins in January 2015, meaning the 2008 Global Financial Crisis and Kazakhstan’s 2009 banking sector stress are not in the estimation window. The 2015 free-float devaluation itself falls within the 18-month burn-in period and is not directly captured — the index’s view of that period begins only with the aftermath, from July 2016 onward.
The index currently covers FX and money markets only. The 2025 rates shock illustrated the limitation: bond market stress is not fully visible without yield and spread data from the government bond market. KASE’s bond total return indices, which became available in late 2022, are too short for reliable inclusion today but will be incorporated as history accumulates.
Monthly credit and deposit data — including the deposit dollarization ratio that historically leads exchange rate stress — are available from NBRK but at monthly frequency with a one-month lag. These are better suited to a companion activity index than a real-time stress measure.
Work on a Kazakhstan Activity Conditions Index (KZ-ACI) combining credit dynamics, real estate prices, and payment system data is underway. Together, the KZ-MCI and KZ-ACI would provide a more complete picture of Kazakhstan’s financial and economic conditions in real time.
Methodology Note
The KZ-MCI uses expanding-window PCA on 13 daily variables across FX and money market clusters, following the approach of Aldasoro, Hördahl, Schrimpf and Zhu (BIS Working Paper No. 1250, 2025). The index is updated daily using current-month PCA loadings, with full reestimation on the first of each month. All readings are expressed in standard deviations from the historical mean. Positive values indicate tighter-than-average conditions; negative values indicate easier-than-average conditions. The index is available live at eigenaxis.io/insights.
This article is for informational purposes only and does not constitute investment advice. The KZ-MCI is a quantitative tool designed to summarize market conditions and should be interpreted alongside qualitative judgment and other information sources.
References
Aldasoro, I., Hördahl, P., Schrimpf, A. & Zhu, X.S. (2025). Predicting Financial Market Stress with Machine Learning. BIS Working Paper No. 1250.
Impavido, G. & Wang, T. (2026). There Will Be Liquidity! But Will There Be Transmission? IMF Working Paper No. 2026/109.
Brunnermeier, M.K. & Pedersen, L.H. (2009). Market Liquidity and Funding Liquidity. Review of Financial Studies, 22(6), 2201–2238.
Download PDF